Business performance dashboards are essential tools that provide organizations with a comprehensive view of their operational health and efficiency. By aggregating key performance indicators and metrics into a visually engaging format, these dashboards empower decision-makers to monitor performance in real-time and make informed choices. In today’s fast-paced business environment, the ability to quickly visualize data can significantly enhance decision-making processes and drive success.
From understanding sales trends to tracking customer satisfaction, the insights gained from effective dashboards can lead to improved strategies and outcomes. By leveraging real-time data visualization, companies can stay agile and responsive to changes in the market, ensuring they remain competitive while also fostering a culture of data-driven decision-making.
Importance of Business Performance Dashboards
Business performance dashboards play a critical role in today’s fast-paced corporate environment. These visual tools enable companies to monitor key performance indicators (KPIs), providing a clear view of how well the organization is performing against its objectives. By consolidating data from various sources into a single interface, dashboards simplify the analysis process, allowing for swift and informed decision-making.
Dashboards enhance decision-making processes by providing stakeholders with immediate access to relevant data and insights. This real-time visibility allows managers to identify trends and anomalies as they occur, enabling proactive responses rather than reactive measures. Moreover, real-time data visualization helps businesses to adapt quickly to changing market conditions, ultimately driving better operational outcomes.
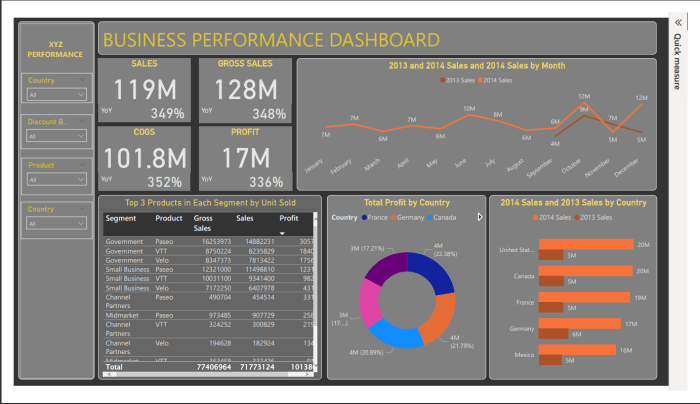
Key Components of Performance Dashboards

An effective business performance dashboard contains several essential components that contribute to its utility and effectiveness. These elements help ensure that the dashboard serves its primary purpose of simplifying data interpretation and facilitating decision-making.
- Data Sources: Integration of multiple data sources ensures comprehensive insights.
- Visualizations: Charts, graphs, and tables that present data in an easily digestible format.
- KPIs: Clearly defined metrics that measure performance against goals.
- User Interface: A clean and intuitive design that promotes ease of use.
Various data visualization tools and techniques enhance the effectiveness of dashboards. Popular visualization methods include bar charts, line graphs, and pie charts, which can effectively display trends and proportions. Metrics commonly tracked in business performance dashboards include sales revenue, customer acquisition costs, and employee productivity rates, all of which provide valuable insights into business performance.
Types of Business Performance Dashboards
Business performance dashboards can be categorized into three primary types: operational, tactical, and strategic. Each type serves a different purpose and targets distinct audiences within the organization.
- Operational Dashboards: Focus on real-time data to monitor daily operations and facilitate quick decision-making.
- Tactical Dashboards: Used by middle management to track progress towards achieving specific goals and objectives.
- Strategic Dashboards: Designed for executives, these provide an overview of long-term performance and trends, helping in strategic planning.
Various industries leverage these dashboard types. For instance, retail companies often use operational dashboards to manage inventory levels in real-time, while healthcare organizations rely on tactical dashboards to monitor patient flow and resource allocation.
Design Principles for Effective Dashboards

An effective dashboard design is crucial for ensuring that users can easily interpret data and draw actionable insights. Best practices for dashboard layout include prioritizing information hierarchy, ensuring that the most critical metrics are prominently displayed.
Guidelines for color schemes and typography are equally important. High-contrast colors enhance readability, while consistent font styles help maintain a professional appearance. Additionally, user-friendly interfaces are essential, as they allow users of varying technical expertise to navigate the dashboard seamlessly.
Tools and Software for Creating Dashboards
Several popular software options are available for developing business performance dashboards, including Tableau, Power BI, and Google Data Studio. These tools offer diverse functionalities and cater to different user needs.
When selecting dashboard software, it is essential to consider several features. These include data integration capabilities, customization options, and user support. While each tool has its advantages, such as ease of use in Tableau, there may also be disadvantages, such as higher costs or limited functionality in some cases.
Implementing Dashboards in Business Environments
Successfully integrating dashboards within an organization involves several key steps. First, it is crucial to clearly define the objectives and metrics that the dashboard will track. Next, a data governance framework should be established to ensure data quality and consistency.
Training staff is vital for effective dashboard utilization. Organizations can implement training sessions or workshops to familiarize employees with the dashboard’s features and functionalities. Furthermore, maintaining and updating dashboards over time is essential to ensure relevance and accuracy as business needs evolve.
Case Studies of Successful Dashboard Implementations
Numerous companies have successfully implemented dashboards, resulting in significant improvements in their performance metrics. For example, a major retail chain utilized dashboards to enhance inventory management, leading to a 20% reduction in stock-outs and a significant increase in customer satisfaction.
Analyzing the impact of dashboards reveals valuable lessons learned. The key takeaway is that customization and user engagement are paramount in ensuring the dashboard’s effectiveness and relevance to business objectives. These insights can serve as a guide for other organizations looking to implement similar solutions.
Future Trends in Business Performance Dashboards

Emerging technologies are expected to influence the development of business performance dashboards significantly. Innovations such as augmented reality and machine learning are poised to enhance data visualization and interaction capabilities.
Trends in data visualization, such as the growing popularity of interactive dashboards and real-time analytics, could further improve dashboard effectiveness. Additionally, artificial intelligence plays a transformative role in dashboard evolution by enabling predictive analytics, helping organizations make data-driven decisions based on future trends rather than just historical data.
Outcome Summary
In conclusion, harnessing the power of business performance dashboards enables organizations to visualize their data, streamline their operations, and enhance their decision-making processes. By understanding the key components, types, and design principles of effective dashboards, companies can implement these tools to maximize their performance metrics. As technology continues to evolve, the future of dashboards will become even more sophisticated, paving the way for innovative approaches to business management.